


Climate Change
Climate Change
- CARBON DIOXIDE(CO2)
- GLOBAL TEMPRETURE
- ARCTIC SEA ICE
- SEA LEVEL
CARBON DIOXIDE(CO2)
The greenhouse effect is the cause of global warming.
The greenhouse effect refers to the insulation effect of the sealed space that transmits sunlight due to lack of heat exchange with the outside world. That is, the short-wave radiation of the sun can be injected into the ground through the atmosphere, while the long-term radiation emitted by the ground after warming is absorbed by carbon dioxide in the atmosphere. Absorbed, resulting in the effect of atmospheric warming.
In recent decades, due to the rapid increase in population and the rapid development of industry, the carbon dioxide produced by breathing and the carbon dioxide produced by the combustion of coal, oil and natural gas far exceed the past levels. On the other hand, due to the deforestation of forests, a large number of farmland has been built into cities and factories, destroying vegetation and reducing the conditions for converting carbon dioxide into organic matter. In addition, the surface waters are gradually shrinking, the precipitation is greatly reduced, the conditions for absorbing dissolved carbon dioxide are reduced, and the dynamic balance of carbon dioxide generation and conversion is destroyed, so that the carbon dioxide content in the atmosphere increases year by year. The increase in carbon dioxide in the air has caused changes in the Earth's temperature.
Increase in Carbon Dioxide levels
co2(parts per million)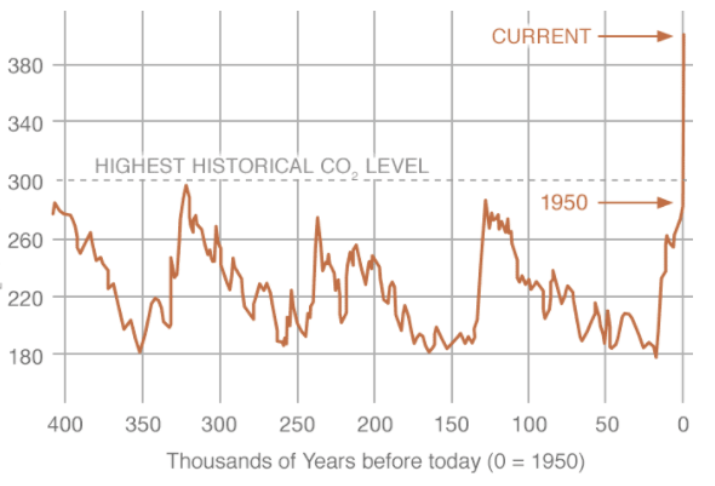
DIRECT MEASUREMENTS: 2005-PRESENT
co2(parts per million)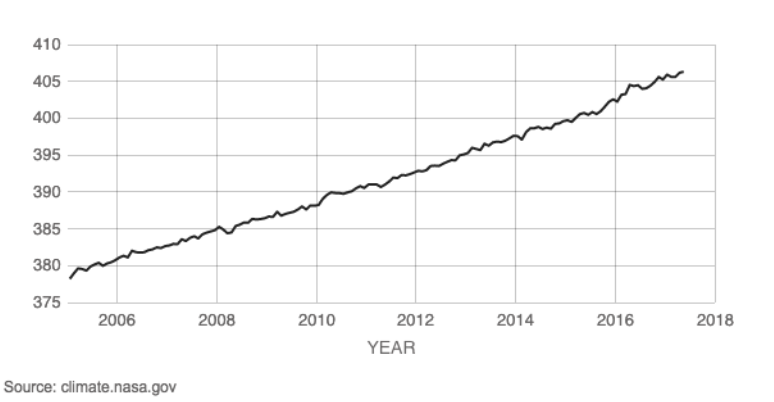
GLOBAL TEMPRETURE
Though warming has not been uniform across the planet, the upward trend in the globally averaged temperature shows that more areas are warming than cooling. Since 1901, the planet’s surface has warmed by 0.7–0.9° Celsius (1.3–1.6° Fahrenheit) per century, but the rate of warming has nearly doubled since 1975 to 1.5–1.8° Celsius (2.7–3.2° Fahrenheit) per century, according to the international State of the Climate in 2017 report.
The 10 warmest years on record have all occurred since 1998, and the four warmest years on record have all occurred since 2014. Looking back to 1988, a pattern emerges: except for 2011, as each new year is added to the history, it becomes one of the top 10 warmest on record at that time, but it is ultimately replaced as the “top ten” window shifts forward in time.
By 2020, models project that global surface temperature will be more than 0.5°C (0.9°F) warmer than the 1986-2005 average, regardless of which carbon dioxide emissions pathway the world follows. This similarity in temperatures regardless of total emissions is a short-term phenomenon: it reflects the tremendous inertia of Earth's vast oceans. The high heat capacity of water means that ocean temperature doesn't react instantly to the increased heat being trapped by greenhouse gases. By 2030, however, the heating imbalance caused by greenhouse gases begins to overcome the oceans' thermal inertia, and projected temperature pathways begin to diverge, with unchecked carbon dioxide emissions likely leading to several additional degrees of warming by the end of the century.
HISTORY OF GLOBAL SURFACE TMPERATURE
Temperature (C)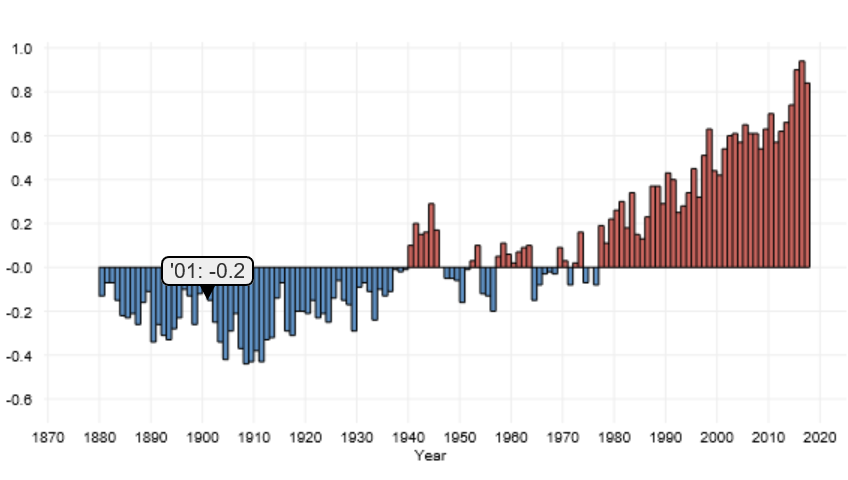
ARCTIC SEA ICE
Arctic sea ice extent for September 2018 averaged 4.71 million square kilometers (1.82 million square miles), tying with 2008 for the sixth lowest September in the 1979 to 2018 satellite record. This was 1.70 million square kilometers (656,000 square miles) below the 1981 to 2010 average, and 1.14 million square kilometers (440,000 square miles) above the record low recorded for September 2012. Prior to September 19, sea ice extent declined at a relatively rapid 14,440 square kilometers (5,580 square miles) per day, significantly faster than in most years. The near-zero loss rate between September 19 and 23, and the very late onset of significant seasonal ice growth after September 23, were atypical of the satellite record.
Sea ice loss during the first half of September primarily occurred within the East Siberian, northern Laptev, and northern Chukchi Seas, in part because winds from the south brought warm air into the region and inhibited ice from drifting or growing southward. Retreat in these areas was partially offset by ice expansion in the eastern Beaufort Sea and the northern Kara and Barents Seas. The old ice that had been persisting in the Beaufort Sea near Prudhoe Bay mostly melted out by the end of September. While the Northern Sea Route opened again this year, as it has every year since 2008, ice lingered in the central section of the southern route of the Northwest Passage between Bellot Strait and Gjoa Haven.
Since the seasonal minimum extent, reached on September 19 and again on September 23 at 4.59 million square kilometers (1.77 million square miles), ice cover has expanded in the Canadian Archipelago, the northern Chukchi and Beaufort Seas, and the East Greenland Sea, while retreating slightly within the Kara Sea.
Arctic sea ice extent as of October 07, 2018, along with daily ice extent data for four previous years and the record low year. 2018 is shown in blue, 2017 in green, 2016 in orange, 2015 in brown, 2014 in purple, and 2012 in dotted brown. The 1981 to 2010 median is in dark gray. The gray areas around the median line show the interquartile and interdecile ranges of the data. Sea Ice Index data.
ARCTIC SEA ICE EXTANT
Million of squarekm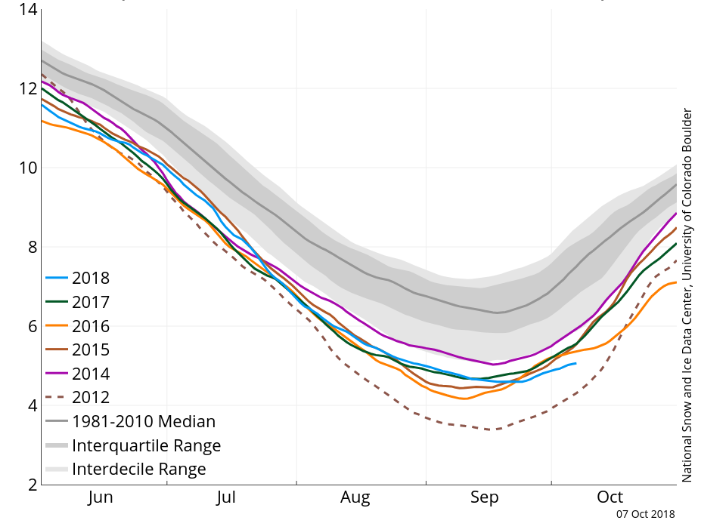
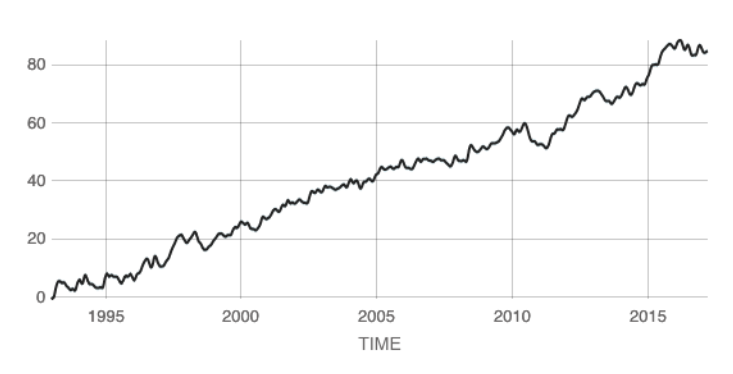
SEA LEVEL
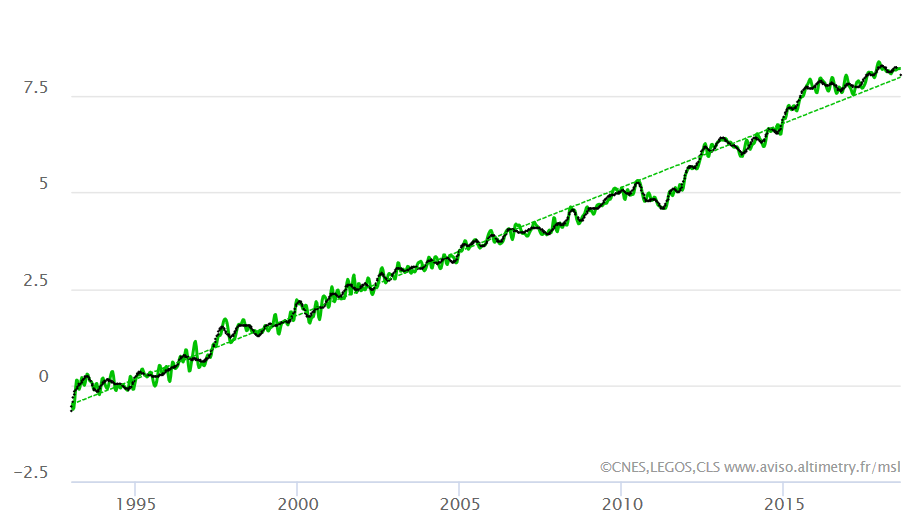
The global mean level of the oceans is one of the most important indicators of climate change. It incorporates the reactions from several different components of the climate system. Precise monitoring of changes in the mean level of the oceans, particularly through the use of altimetry satellites, is vitally important, for understanding not just the climate but also the socioeconomic consequences of any rise in sea level.
With the satellite altimetry missions, the global mean sea level (GMSL) has been calculated on a continual basis since January 1993. 'Verification' phases, during which the satellites follow each other in close succession (Topex/Poseidon--Jason-1, Jason-1--Jason-2, then Jason-3--Jason-2), help to link up these different missions by precisely determining any bias between them. Saral, Envisat, ERS-1 and ERS-2 are also used, after being adjusted on these reference missions, in order to compute Mean Sea Level at high latitudes (higher than 66°N and S), and also to improve spatial resolution by combining all these missions together. In addition, permanent monitoring of quality during the missions (Calval) and studies of the necessary corrections of altimetry data regularly add to our understanding and knowledge.
This data has shown a more-or-less steady increase in Global Mean Sea Level (GMSL) of around 3.2 ± 0.4 mm/year since 1993.
NASA SATELLITE DATA: 1993-PRESENT
RATE OF CHANGE 3.2 Millimeters Per Year
Sea height variation from 1993
Sea Level Change(mm)